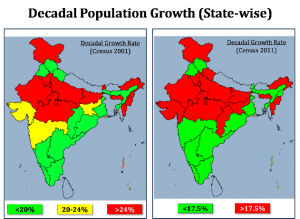
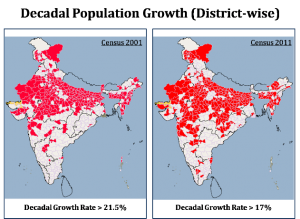
It stands to reason that the decadal population growth rate should also exhibit pattern similar to the population density since the growth in population density and growth in population will move in tandem if area of the state or the district has remained constant.
If we look at the 2001 census data for the decadal population growth among the states, three distinct belts emerge (Table). First are the states with low decadal growth rate of below 20%, basically in the south-eastern part of the country and the northern trio of Punjab (19.8), Himachal Pradesh (17.5) and Uttarakhand (19.2). Second the states with higher than 24% growth in the ‘cow belt’ and surprisingly a number of the seven sisters. Intermediate growth rate of 20 to 24% marks the remaining states in a fairly contiguous pattern.
But when we look at the district levels a threefold grouping does not help. In its place a two-fold classification of decadal growth rate of below or above 21.5% gives two clear groups of states.
How does the picture of 2011 look like? The three fold division in 2001 now gets into a twofold divide. There are states growing at less than 17.5% decadal growth rate on the south-eastern side and Punjab and Himachal Pradesh in the north. Others states in the north and north western side, and many states in the north east, growing at greater than 17.5%. A matter of concern should be the states of Uttarakhand and Chhattisgarh which show rather high rate of decadal growth compared to the 2001.
At the district level 2011 map shows an even more striking pattern. At a cut off level of 17% decadal growth rate, India gets clearly divided into two groups. Again we see a south-eastern group of districts and districts of Punjab and Himachal growing below this cut-off level with rest of the districts continuing at a faster pace.


What conclusions do viewers like to draw from these patterns?
[Win prizes for insightful contributions and acknowledgments certainly.]
