When we talk of the patterns of population density or the decennial growth rates, the distinction between the urban and the rural segment assumes significance. The urban population in Indian is growing – some say it is growing significantly faster than the rural population. Is that really the case? It is important to check this out on the basis of the census data on urbanization in India for 2001 and 2011. Is the popular perception that the urban population is growing rapidly correct, or does it need to be qualified? This is important since the perception of population ‘explosion’, nurtured and strongly believed in, by the urban elite does form the basis of many of our policy prescriptions and attitude towards the poor and the women.
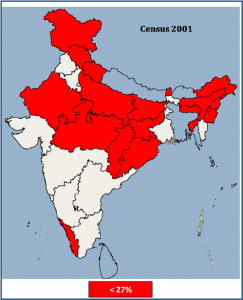
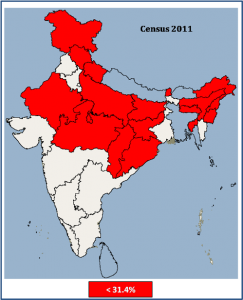
Table 1 gives the % urban population in various states in 2001 and 2011. The urbanization levels vary widely from state to state ranging from a very low level of urban population even in 2011, in Himachal (10%), Bihar (11.3%) and Assam (14.1%). If we see the map for 2001, however, we see a contiguous belt of northern and eastern states with less than 27% urban population. Even in 2011 the pattern remains similar if we raise the cut-off to 31.4%. Two notable exceptions are Kerala and Goa in the south where the urban population has jumped from 26% to 46% for Kerala and from 50% to 62% for Goa. In the north east, Sikkim, Nagaland and Tripura have urbanized significantly. West Bengal’s urbanization is historical in nature but one can see that its urbanization has not had the kind of spread effect that we see in south and the west and even in the Punjab, Haryana and Uttarakhand belt.
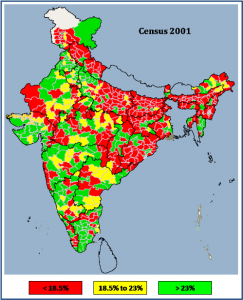
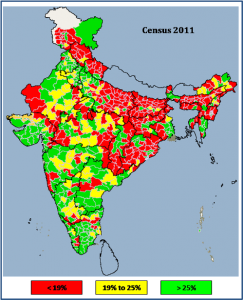
If we go to the district level, we again see similar endurance of the patterns. For 2001, the map provides clusters of low (below 18.5%) medium (18.5% to 23%) and high (>23%) urban population. Obviously if we keep same cut off levels for 2011, the area under low urban population will show a decline and that under high urban population will show an increase. But we need to appreciate that the all-India urban population % has gone up from 27.8% in 2001 to 31.2 % in 2011. We need to revise the cut-off levels upwards to see the relative patterns of urban clusters.
A revision of cut-off levels to 19%, and 25% respectively, shows that the relative pattern of urbanization has remained nearly similar.
Interestingly, the modification in the cut off for the low, medium and high urban population % regions for pattern of relative urbanization similar to that in 2001 is well below the all India increase of above 3% in the urban population%. How do we account for this? Probably the more urbanized regions are urbanizing more rapidly?
To examine this, let us place the districts in four categories; – urban population of more than 10 lakh (or 1million), between 5 to 10 lakh, 1 to 5 lakh and below 1 lakh in 2011. There are about 99 districts with 1 million plus population, 105 in the urban population range of 5-10 lakhs, 284 between 1-5 lakh and 152 below 1 lakh. Are these urbanising evenly?
In the 1 million + category there are many districts, about 22, with high urban population (above 70%), but in the 5-10 lakh bracket districts such number is just 2, in the 1-5 lakh category only 2 districts have urban population above 60% while in the <1lakh population group there are hardly any districts with more than 60% urban population.
More interestingly however, if we see the relation between the % urban population in 2001 and that in the 2011 through a regression analysis for the four categories of districts, an interesting feature emerges. This is shown in the 4 equations below;
UrbPct 2011 = 0.90*UrbPct 2001 + 11.1 [R Sq = 0.89] —- (1 million+)
UrbPct 2011 = 0.98* UrbPct 2001 + 4.4 [R Sq = 0.85] —— (5-10 lakh)
UrbPct 2011 = 1.1* UrbPct 2001 + 0.32 [R Sq = 0.87] —— (1-5 lakh)
UrbPct 2011 = 1.01* UrbPct 2001 + 1.65 [R Sq = 0.82] —– (< 1 lakh)
This implies that the districts with larger urban population in 2001 have urbanized to a larger extent. The 1 million+ districts have added on an average 8-10% urban population, districts with 5-10 lakh population have added about 4.5%, districts with less than one lakh urban population in 2001 have added just about 2.5% while districts in the 1-5 lakh category have indicated about a 10% increase in the urbanization %.
The gender gap: Interestingly, the gap between the %urban population for the male and the female population has narrowed between 2001 and 2011 both at the all India level and the district level in different size ranges. In 2001 the urban male population accounted for 28.3% of the total male population while the urban female population accounted for 27.3% of the female population. This gap has narrowed in 2011 with the urban male and the urban female population accounting for 31.4 and 30.9% of the total male and the female population respectively. In the 1 million plus districts and the 1-5 lakh districts category too, the gender gap has reduced between 2001 and 2011.


