NFHS-4: Districts in that could aspire to become malnutrition free early! (Part-2)


This is further to the preliminary analysis of the NFHS-4 data for rural part of Odisha.

This note identifies potential districts which can aspire to become malnutrition free early. This analysis shifts the emphasis from the high burden districts to the least burden districts. Such a shift is necessary given the goal of achieving a malnutrition free India with emphasis on district level planning, convergent action and monitoring. For this it is necessary to identify districts which have the best potential to become malnutrition free and become a role model other districts in the state. Ernakulum did provide an example of such a “role model” during the total literacy campaign.

malnutrition

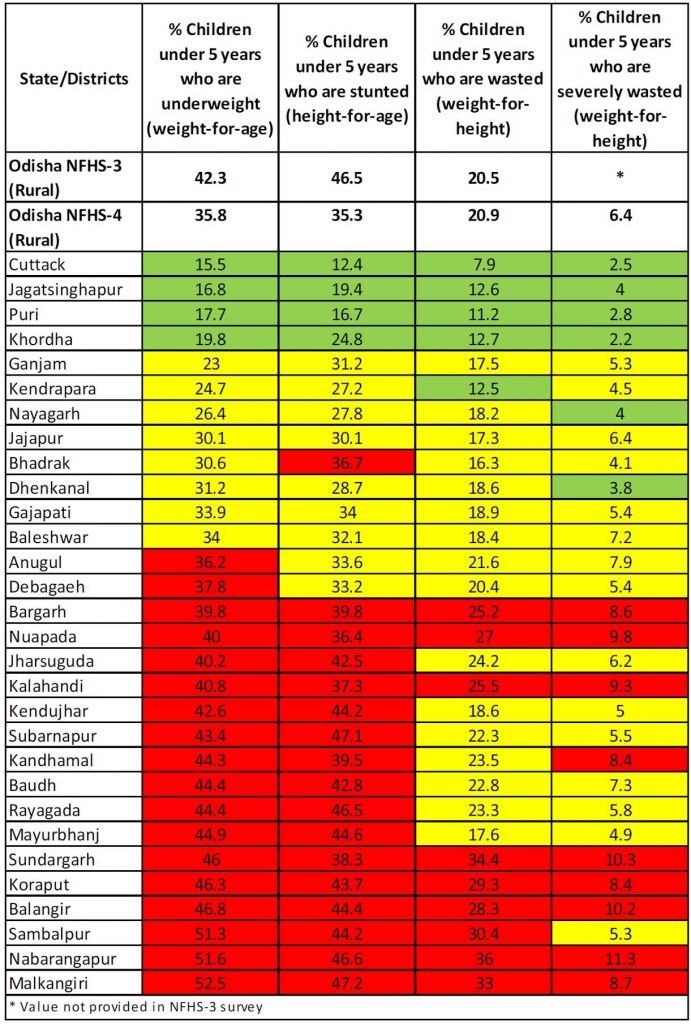
Table – 1 Levels of malnutrition in districts of Odisha NFHS-4

The methodology can be used for other states as well. Every state has districts that have defied odds and have brought down levels of malnutrition well below the state average. These are, in certain sense, closest to the “goal – post” of becoming malnutrition free. These are “positive deviants” within a state which we need to identify, celebrate and push systematically towards becoming malnutrition free. We illustrate below one such method of identification of such districts based on the NFHS-4 data.

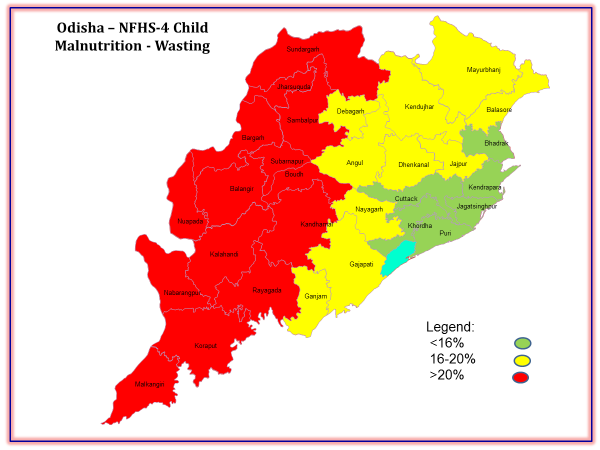
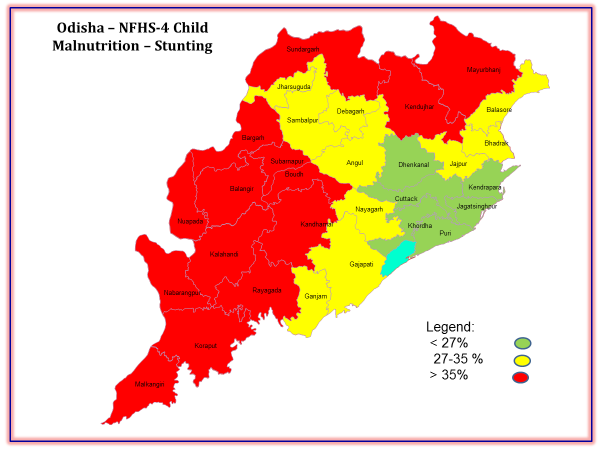
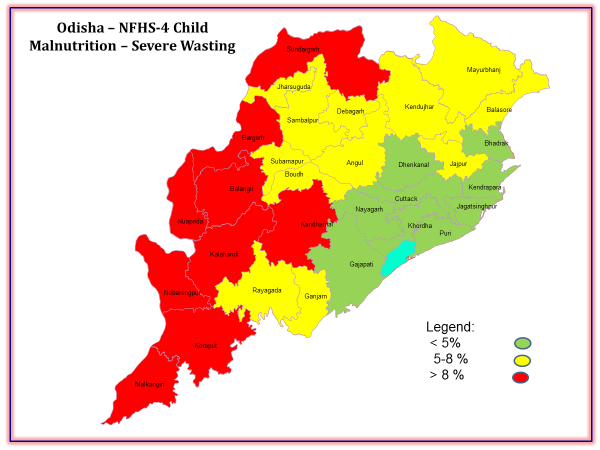
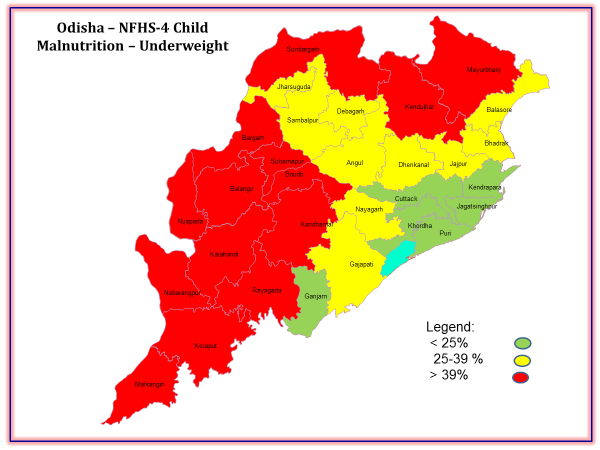
To recapitulate, the earlier analysis had presented the data on levels of malnutrition at district level, colour coded by high (red), medium (yellow) and low (green) levels of malnutrition (see table 1).

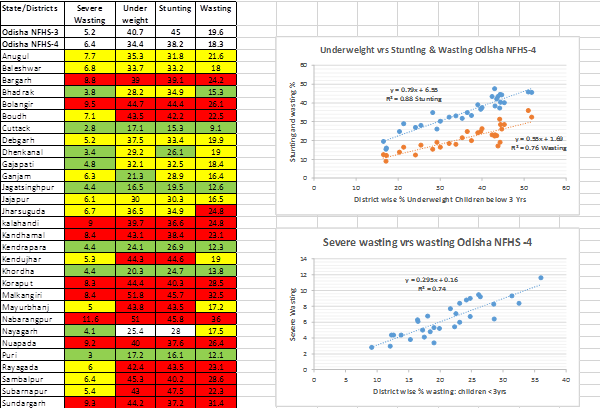
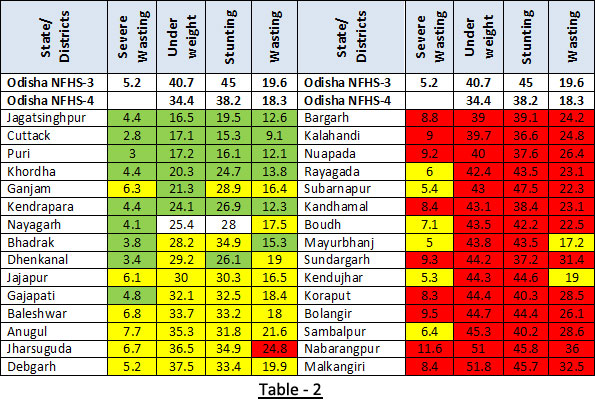
While the above table itself allows us to identify the top three to four, low burden districts, the pattern becomes clearer if we arrange the districts in ascending order of underweight and take a look at top 5-6 districts. This is done in Table – 2 below. For Odisha, Jagatsinghpur leads the pack with Cuttack, Puri and Khordha following closely. We select districts with least wasting and underweight rather than least stunting, for, removing stunting is a long haul while addressing wasting is relatively quicker and the number of children to be taken care of is less. We therefore, must tackle wasting first and to the extent possible underweight. We should also note the low levels of severe wasting in these districts as pointed in earlier analysis as well.

malnutrition

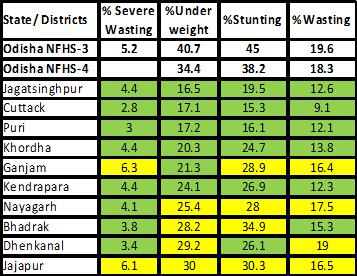
Table – 2 Levels of malnutrition in least burden districts in Odisha

Having identified these districts, we next look at various correlates of malnutrition and find out the district which have performed well above the state average in respect of maximum number of correlates. NFHS-4 provides data in respect of a number of such parameters. We have selected 43 such parameters and have arranged these in the life cycle sequence starting from the new born to the adolescent girl and the pregnant mother. The parameters have further been organized into major clusters i.e. child anthropometry, infant and young child feeding practices, immunization, management of diarrhoea and ARI, women’s marriage, health, ante natal care, post-natal care and educational background among others. These indicators have again been colour coded depending upon their levels with level to the state averages, and in some cases where the state average is itself rather low, the colour coding has been done in terms of absolute performance.

Table 3: Levels of malnutrition in least burden districts in Odisha (Source: NFHS-4) https://goo.gl/Y6Hcaf

Jagatsinghpur and Puri have the largest number of well performing indicators, not Cuttack and Khordha. Further, these two districts perform below par mainly in the IYCF segment, i.e. early initiation of breastfeeding, and adequacy of diet to young children. Other two important parameters are the sanitation coverage and mothers with 10 plus years of schooling. The above analysis is represented through radar diagram where each cluster has been assigned certain score and the achievement of the district marked against the full score. While doing an individual district analysis, it is also possible to do a full parameter radar diagram. Such a radar diagram allows the district to prioritise its areas of intervention. The issue of relative weightage of these parameters will however, remain. That will be taken up separately.

radar_diagram

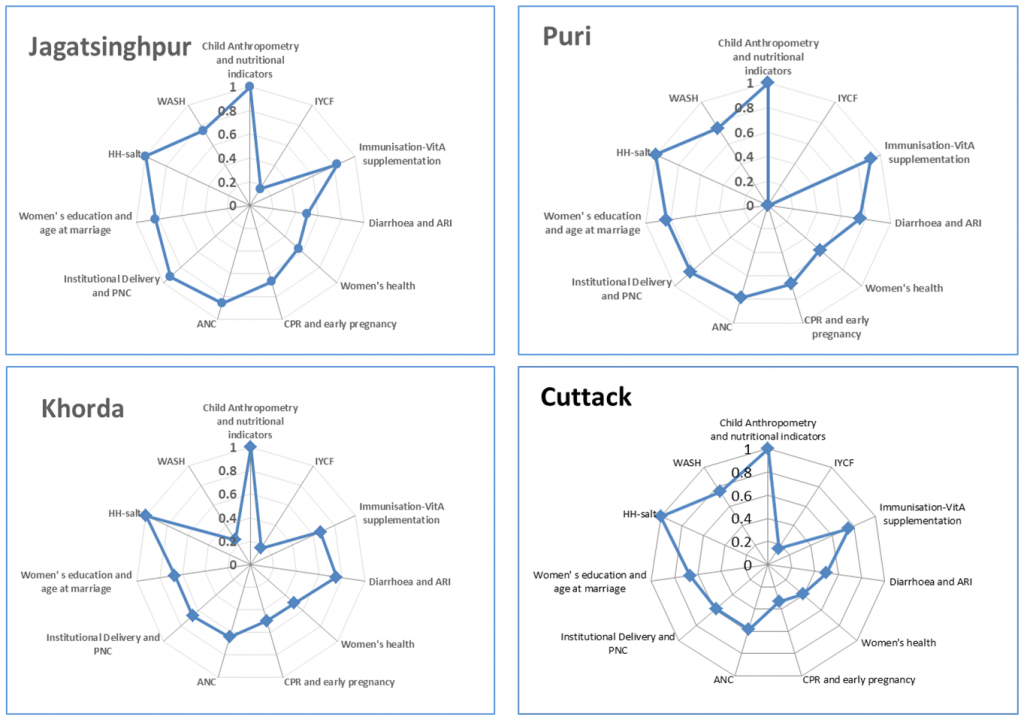
Figure 1: Radar diagram showing performance of best selected districts on different indicators that affect nutritional status of children

Burden of the problem: We now turn to an interesting aspect of the problem- the burden in absolute numbers. How many children are there likely to be moderately or severely malnourished? Every district will like to know this. We have used an easy but reasonably accurate estimate based on the census 2011 data for children in the 0-6 year age group. This number represents seven cohorts. As such 5/7th of this number will give rough estimate of the children below 60 months in the given district. Using NFHS-4 data we estimate number of malnourished children.

text

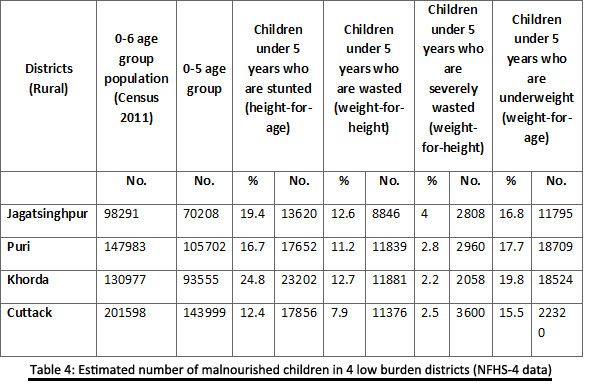
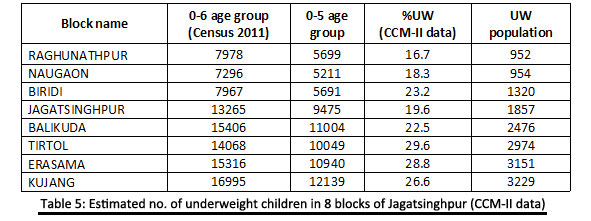
Table 4 above shows that Jagatsinghpur and Puri have the least burden of malnourished children in absolute number. In fact, the number of severely wasted children in both the districts is just below 3000. The corresponding figure for moderately wasted is about 9,000 and 12,000 respectively while children that are underweight are about 12,000 and 18,000 respectively. The average number of children within most Anganwadis will be well below a double digit figure. If we look at the ICDS project wise figure e.g. the 8 blocks of Jagatsinghpur, the numbers will be even more manageable even if we use the % underweight figures from an earlier survey CCM-II done for Odisha in 2011.

text

It can be nobody’s case that these districts cannot take up the task of reducing malnutrition in a campaign mode and achieve early results. The time to begin this is NOW !

[PS: Odisha is lucky to have block wise data on nutritional status and other parameters through an earlier, large sample, survey CCM-II. We will carry out similar exercise with block as a unit to identify the “closest to goal post” blocks in every district. That will be presented in the next part of our analysis.]

Satish B Agnihotri, Ayushi Jain

Nutrition Discussion Group, CTARA, IIT Bombay, Powai Mumbai 400076

Contact us: 9810307353 (Mobile), 022 576 6476

Email ID: sbagnihotri@gmail.com, ayushijain@iitb.ac.in


NFHS-4: An analysis of district level malnutrition data for Odisha


NFHS – 4 provides, for the first time a district level data on nutritional status of children below the age of 5 years. This provides an excellent and timely opportunity to plan for eradication of child malnutrition at the district level. A quick preliminary analysis of the district level child malnutrition levels, reveals certain important aspects. This is presented below.

Table -1 below presents the data on wasting, underweight and stunting in a colour coded form. These three aspects of child malnutrition are interrelated. This relationship is brought out in Figure 1a. There is a clear linear relationship between underweight on one hand and stunting and wasting on the other. The very robust nature of both the linear regressions (R Sq of 0.88 for stunting and 0.76 for wasting), has a bearing on programme implemention. Collecting good quality data on underweight can give us a good indication of the levels of wasting and stunting as well. Hence we need not initiate routine measurement of height through Anganwadi workers or ASHAs. The task of estimating stunting can be left to periodical NFHS surveys which will now be taking place at 3 year intervals1. At Anganwadi level recording weight and use of MUAC tapes to identify wasting will be adequate at this stage.

text

Table – 1                                                                              Figure 1a and 1b

Measurement of height or length (child below 2 years) is not an easy task and is error prone if done by workers not adequately skilled and experienced. As such burdening the Anganwadi workers with this task is best avoided.

It is useful to rearrange Table – 1 in descending order of underweight. This brings out the low levels of severe wasting in coastal belt. Districts which have low figures of severe wasting have mostly got other parameters right, and, more importantly, where this has gone wrong, other parameters have gone wrong too.

Table -2, quite clearly, brings out the importance of reducing the incidence of severe wasting. It also shows the regional contiguity of the parameters and the need for separate planning for different districts.

text

The coastal districts of Jagatsinghpur, Cuttack, Kendrapada, Puri and Khordha have done well in all parameters. While Ganjam shows better result in underweight, it needs to improve on rest of the parameters. The case of Nayagarh is interesting, a modest reduction in underweight and stunting (not colour coded purposefully) would have put it in the league of the other coastal districts. Baleshwar and Jajpur are somewhat of a surprise and may need a closer scrutiny.

The Angul, Jharsuguda, Debgarh belt has intermediate position along with Gajpati, which shows a low incidence of wasting. Whether this is consistent or a one off case needs to be seen.

On the other end of the spectrum, districts of Southern and some of the districts in Western Odisha have not fared well. Mayurbhanj and Keonjhar two contiguous tribal districts have done relatively better in reducing wasting, but not other parameters.

The regional dimension of the situation can be readily appreciated if we look at the Odisha map as brought in Gigure 2a-2d below. The maps clearly show three separate clusters in green, yellow and red corresponding to the least, middle level and high malnutrition.

text

Figure 2a – Wastingwasting

Figure 2b – Stuntingtext

Figure 2c – Severe Wasting

severe

Figure 2d – Underweight

There is a very clear case for taking Dhenkanal, Nayagarh, Gajapati and Ganjam belt from the yellow zone to the green zone. So is the case with the Jajpur – Bhadrak – Balasore zone.

One area of focus would be the Jagatsinghpur, Kendrapada and Cuttack belt which is‘closest to the goal-post’ of removing moderate and severe malnutrition. It may be a useful idea to monitor all the severely wasted and underweight children on an intensive basis and take remedial measures.

This preliminary analysis is useful in indicating where does the shoe pinch the most. A more detailed analysis needs to be done by looking at other parameters under NFHS-4 i.e. the correlates of child malnutrition. This is presented in the next stage of the analysis where we look at the districts with the best potential to achieve the status of being “malnutrition free”.

Satish B Agnihotri, Ayushi Jain

sbagnihotri@gmail.com Tel 9810307353 (Mobile)

Not by Gigawatts alone!

– S B Agnihotri1

India has set itself ambitious targets for generating solar power. The recent RE-Invest event, held in New Delhi, was an eloquent testimony to this ambition. It was a spectacular event, and the Prime Minister himself, in his Vigyan Bhavan address pointed out the ‘order of magnitude’ change in the thinking. India was now talking of Gigawatts (GW) of solar power and not just Megawatts (MW), and this was not an empty rhetoric. Leading lights of the India Inc, be it private sector, PSUs, Banks lined themselves up in placing concrete pledges before the Prime Minister committing themselves for generation of this power. One must congratulate the MNRE for the sheer magnitude, level and reach of the event.

One could not escape noticing however, that the event essentially ended up becoming a Renewable Power Invest, than Renewable Energy Invest. Even within the Power, the focus was almost exclusively on the solar PV. Other sources were in the ‘also ran’ category, wind power leading the pack, but in the ‘also ran’ silo nevertheless.

While there cannot be any dispute that India should exploit its solar power potential, MNRE needs to seriously ask itself if it has to remain just Solar MW centric, that too grid oriented. Does power availability in itself ensure access, equity or efficiency and, more important, does it address the requirements of energy in coking, domestic lighting, industrial heating and decentralized availability of power?

Ironically, renewable energy holds the key to a sizeable part of the subsidy burden in two of our biggest subsidy guzzling sectors, fertilizers (about 1 lakh crore per annum) and petroleum products about 60,000 crore. It also holds the key to the considerable inequality in the access to and consumption of such basic energy as used in household lighting and cooking, and the need for quality power in rural industry. But before looking at these RE specific solutions, it is useful to take a look at the nature of these inequalities, and put the problem in its perspective.

Access to electricity for domestic lighting:

Most of us take electricity for domestic lighting as granted. In urban India this is a fair assumption as Fig. 1a below will show. The number of districts with more than 85% households use electricity for lighting is large indeed. However, as Fig.1b shows, our rural brethren may not be that lucky given that the number of districts where just 75% households use electricity as source for lighting is far less, compared to urban areas.

Percentage of households using electricity for domestic lighting2

These two figures on access to electricity for lighting purposes, do not reveal the story of the inequality in levels of consumption of electricity. Figure 2a and 2b below gives the relevant information based on NSSO data in terms of levels of electricity consumption in the urban and the rural areas at all India level and within a state.

One could clearly see that the energy consumption in the household in the top rural decile is comparable to that consumed by the household in the fourth urban decile. Very interestingly, the divide between the rural and the urban regions of a given state tells one story, but there are considerable inequalities between states as the figure 3a and 3b reveal. The size of the two graphs has been kept proportionate to the levels of energy consumed to give a ready visual appreciation.

What these gaps clearly bring out is that a prosperous person in Jharkhand enjoys far less electricity compare to his counterpart in Haryana. In fact households in the second poorest deciles in rural Haryana enjoy better levels of electricity consumption compared to what the households in the top prosperity decile in rural Jharkhand!

It is also important to notice that the lack of access to energy seems to affect specific clusters. Let us take the example of lack of access to electricity for domestic lighting. Such households almost invariably use kerosene for lighting. Figure 4 gives the map of India, showing the districts where 50% or more rural households use kerosene for this purpose.

Census 2011 data indicates that there are about 8 crore households in the country still using kerosene as source for lighting. A recent survey, done in the course of IIT Bombay’s programme for providing 1 million solar lamps to students who study using kerosene lamps (supported by MNRE), showed that a household typically uses 30-35 litres kerosene per year for lighting purpose. Government pays subsidy of about Rs 33/Litre effectively giving a subsidy of 1000 to 1200 per family per annum. If a onetime subsidy of Rs 1200 is given instead to these households for a modest solar home lighting system, the saving on the kerosene subsidy for the next 5 years (which is the battery life) will be Rs 6000 or a 400% return on investment!! This, one time, home lighting subsidy is not, therefore, a charity. It is an investment which must come from Ministry of P&NG rather than from MNRE. It is worth noting that the annual subsidy bill on kerosene is around 30,000 Crores and MNRE annual budget about Rs 2500 crores.

The Bharat – India divide above is equally glaring in the use of fuel for cooking.

As Fig 5a and 5b show, even today, 63% of the rural and 20% of urban households continuing to depend on firewood with far lower efficiency of combustion compared to Bio gas or LPG. More disturbingly the LPG penetration in rural areas is a paltry 11%. Nearly two crore households depend upon cow dung cake as the fuel source. Yet, MNRE programmes on bio gas and improved cookstoves are on the backburner!

Bio manure again represents the same story of a merit good being looked down upon as subsidy. A 2 cubic meter bio-gas plant generates equivalent of about 80 kg of urea saving therefore about Rs.1000 as subsidy per annum based on urea subsidy of about Rs 12 per kg. If Deptt. of Fertilizer provides additional subsidy of Rs 3000 for a 2 cubic meter bio-gas plant they will start saving Rs1000 per annum, year on year from year 4. It is important to promote bio gas on a massive scale even allowing the use of bag digesters which may last only 10 years. With the decision of promoting sale of the Phosphate rich Organic Manure (PROM) through fertilizer industry, the bio gas economics becomes even more attractive and saves subsidy and foreign exchange on import of phosphetic fertiliser.

It is important however to introduce innovations in the bio gas technology. Two efforts are worth mentioning, the first being recycling of the water after separation of the slurry into semi-solids and the liquid portion. This has been successfully tried out by the Bharatiya Agro Industries foundation (BAIF) using a small pump. The semi solid manure can the be phosphate enriched and sold.

A second promising innovation is in the field of dry anaerobic fermentation at higher temperatures e.g. 48-50 degrees. This has been tried out in the food waste digestion e.g. at Akshyayapatra Bangalore, and reduces the digestion time drastically to 17-18 days and thereby bringing down the digester cost as well.

MNRE needs to take serious cognizance of such developments and promote these to a massive scale in tandem with the Ministries of Animal Husbandry and Fertilizer. The Dairy sector has come a long way and today the Central Ministry has a database of all private farms having 50 animal or more. Likewise, the States have a database of all “Progressive Farmers” supported by the scheme of the Ministry to keep at least 10 pedigree cattle. All these must be covered with bio-gas plant on a saturation basis . For this the MNRE needs to think scale and go for a tender-based approach for installation of bio-gas plants in a lot of 50 or 100 plants with 5 year O&M cost being built in. This will bring down the cost, boost rural local employment, and use of organic fertiliser. As the strategy for solar PV has demonstrated that large and steady volume of orders does bring the costs down and reduces, if not eliminate subsidy.

The lack of push to the improved cookstove programme is another anomaly given that even today 10.5 crore rural and 1.5 crore urban households use fire wood as fuel for cooking with consequent impact on environment and pose health hazard to mother and children. Use of other bio mass like cattle dung and crop residue pose even bigger health hazard. Ironically even in Delhi over one lakh households use firewood.

MNRE on the other and has remained preoccupied with creation of standards and stringent (some feel impractical) conditions on the cook-stoves to be supported by them. What we need is a nuanced approach. We need to promote portable forced draft cook-stoves wherever use of fire wood and availability of electricity coincide as in the hilly areas, urban areas and the north eastern states (Agnihotri and Maithani, 2015 ibid). Likewise, we need to push for chimney using earthen chulha in the coastal areas where stagnant air or inversion conditions, that trap the smoke from household chulha, are not a problem. Even use of retrofits like iron grates and twisted tapes can, optimized for a local terrain, improve the efficiency of cook-stoves substantially.

We finally come to bio-mass gasifiers. There is a huge scope for use of these gasifiers at a small scale (typically from 10-500 KW). In telecom tower sector itself, 4-5 lakh reliable, remotely controlled and remotely monitorable bio-mass gasifiers would replace diesel gensets. Further, for rural industrial applications, bio-mass gasifiers of less than 1 MW size are economically viable. These applications range from foundry, aluminum based industry, to biscuit, candle, perfumery making, to sodium silicate and glass manufacturing and dyeing / silk reeling and the ubiquitous puffed rice making. In fact, in some cases the payback period without subsidy is claimed to be between 6-24 months. Bio-mass gasifiers also serve the purpose of boosting manufacturing sector, creating local skilled employment on a sustainable basis, save fossil fuel and pave the way for decentralised energy for villages where grid has not reached.

It is ironical that these gasifiers have not been taken to scale. A probable impediment is lack of standardisation and upgradation of technology. Thanks to the stringent requirement of the telecom tower sector, gasifiers with improved specifications are now available. All that MNRE needs to do is to create specifications, develop vendor base and offer a line of credit. It will be tragic if the sector does not take off.

We have not touched here a huge sector of generating Gigajoules through solar steam and hot water stored at high pressure for industrial and institutional usage. There is a crying need to address this need as the current practices involve a sub-optimal use of fossil fuel. Besides, solar thermal technology is much more compatible with the philosophy of ‘make in India’, needs shorter loan tenures, reduces carbon footprints. But this is a large topic by itself, and need to be debated separately.

To sum up, the excessive emphasis of grid centric GW power generation primarily through solar PV, may not be the optimal policy for the MNRE to pursue. It shifts the focus away from the much needed emphasis on issues of energy access, inequalities thereof and the issue of efficiency. To partly rephrase the great Urdu poet Faiz,

aur bhi gham hain zamaane meiN Gigawatt ke siwa
raahateiN aur bhi haiN faqat Grid ki raahat ke sivaa
mujh se jid kar ke Megawatts, mere mehebuub, na maaNg


1Satish B Agnihotri (sbagnihotri@gmail.com) is a retired IAS officer, and has served as Secretary to Government of India in the MNRE and later as Secretary Co-ordination, in the Cabinet Secretariat. However, the views expressed are personal. Citation: Energy Next, 2015, Vol 5 No 7, Pp 26-28.

2For a more detailed analysis of the pattern of use of electricity and kerosene for domestic lighting, various sources of fuel for cooking and the changes between 2001 and 2011, based on census data see Agnihotri and Maithani 2015: Energy access – tracing the contours of inequality, CSE, New Delhi http://www.cseindia.org/docs/aad2015/Contours-of-inequality2015.pdf.