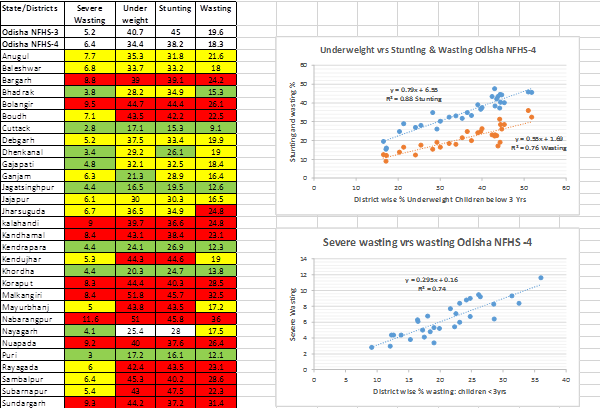
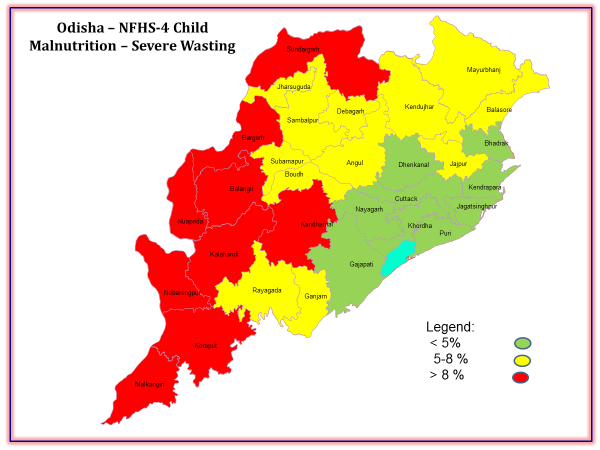
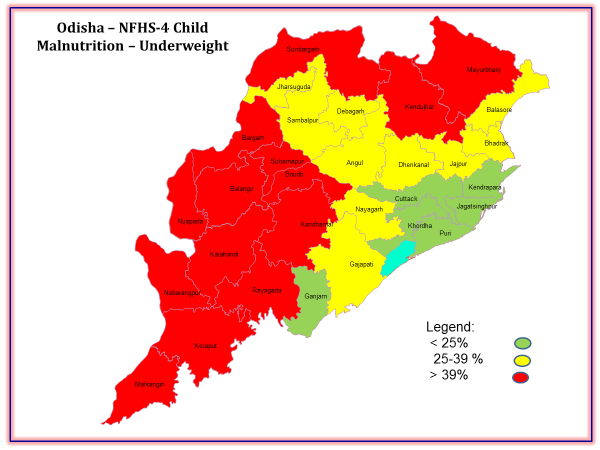
This is further to the preliminary analysis of the NFHS-4 data for rural part of Odisha.
This note identifies potential districts which can aspire to become malnutrition free early. This analysis shifts the emphasis from the high burden districts to the least burden districts. Such a shift is necessary given the goal of achieving a malnutrition free India with emphasis on district level planning, convergent action and monitoring. For this it is necessary to identify districts which have the best potential to become malnutrition free and become a role model other districts in the state. Ernakulum did provide an example of such a “role model” during the total literacy campaign.
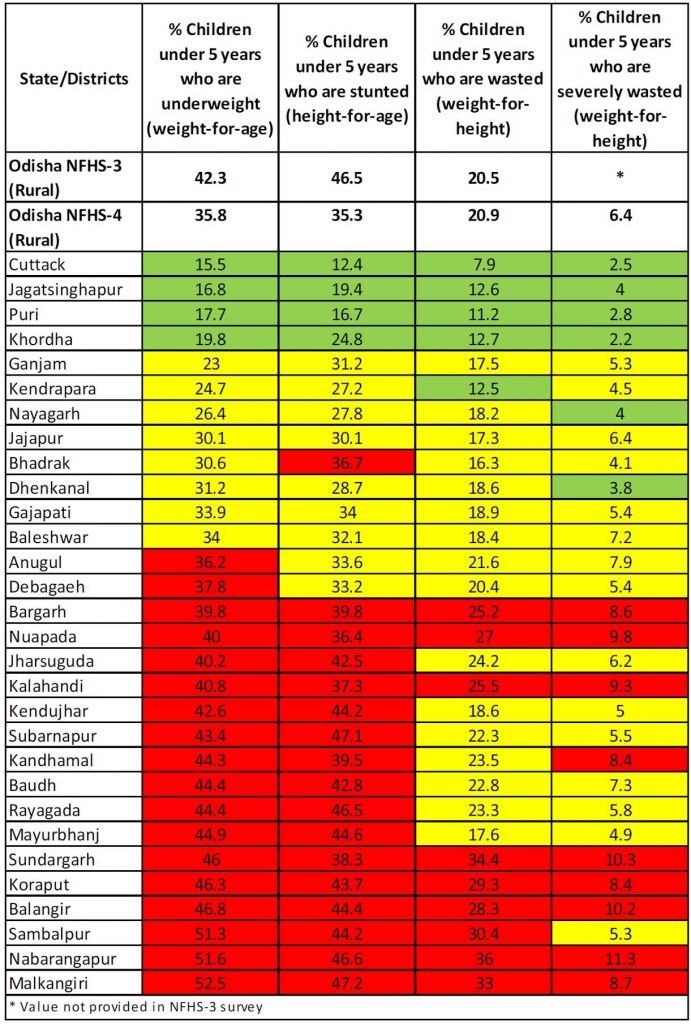
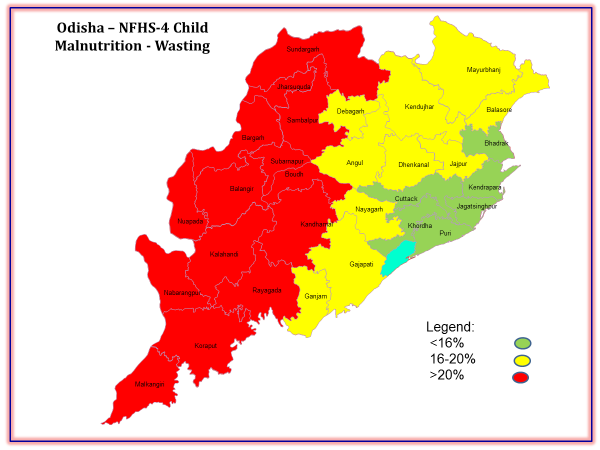
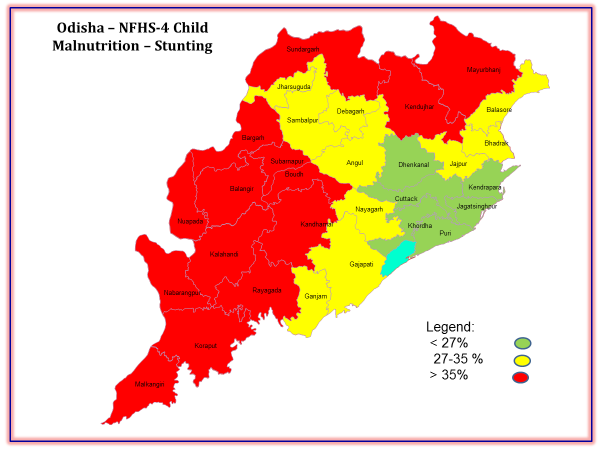
Table – 1 Levels of malnutrition in districts of Odisha NFHS-4
The methodology can be used for other states as well. Every state has districts that have defied odds and have brought down levels of malnutrition well below the state average. These are, in certain sense, closest to the “goal – post” of becoming malnutrition free. These are “positive deviants” within a state which we need to identify, celebrate and push systematically towards becoming malnutrition free. We illustrate below one such method of identification of such districts based on the NFHS-4 data.
To recapitulate, the earlier analysis had presented the data on levels of malnutrition at district level, colour coded by high (red), medium (yellow) and low (green) levels of malnutrition (see table 1).
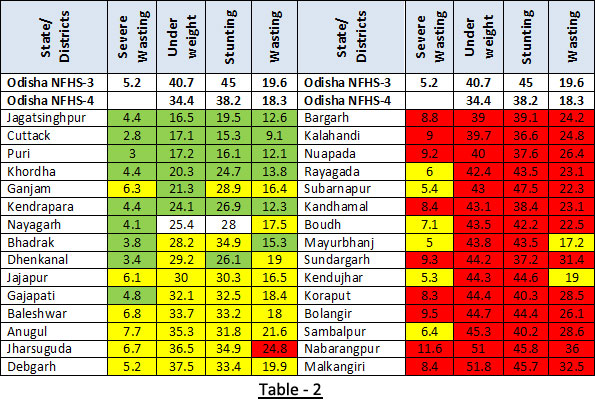
While the above table itself allows us to identify the top three to four, low burden districts, the pattern becomes clearer if we arrange the districts in ascending order of underweight and take a look at top 5-6 districts. This is done in Table – 2 below. For Odisha, Jagatsinghpur leads the pack with Cuttack, Puri and Khordha following closely. We select districts with least wasting and underweight rather than least stunting, for, removing stunting is a long haul while addressing wasting is relatively quicker and the number of children to be taken care of is less. We therefore, must tackle wasting first and to the extent possible underweight. We should also note the low levels of severe wasting in these districts as pointed in earlier analysis as well.
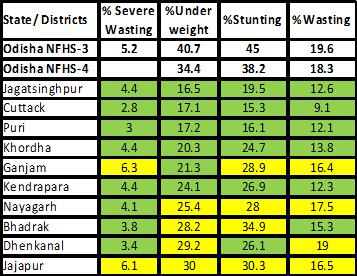
Table – 2 Levels of malnutrition in least burden districts in Odisha
Having identified these districts, we next look at various correlates of malnutrition and find out the district which have performed well above the state average in respect of maximum number of correlates. NFHS-4 provides data in respect of a number of such parameters. We have selected 43 such parameters and have arranged these in the life cycle sequence starting from the new born to the adolescent girl and the pregnant mother. The parameters have further been organized into major clusters i.e. child anthropometry, infant and young child feeding practices, immunization, management of diarrhoea and ARI, women’s marriage, health, ante natal care, post-natal care and educational background among others. These indicators have again been colour coded depending upon their levels with level to the state averages, and in some cases where the state average is itself rather low, the colour coding has been done in terms of absolute performance.
Table 3: Levels of malnutrition in least burden districts in Odisha (Source: NFHS-4) https://goo.gl/Y6Hcaf
Jagatsinghpur and Puri have the largest number of well performing indicators, not Cuttack and Khordha. Further, these two districts perform below par mainly in the IYCF segment, i.e. early initiation of breastfeeding, and adequacy of diet to young children. Other two important parameters are the sanitation coverage and mothers with 10 plus years of schooling. The above analysis is represented through radar diagram where each cluster has been assigned certain score and the achievement of the district marked against the full score. While doing an individual district analysis, it is also possible to do a full parameter radar diagram. Such a radar diagram allows the district to prioritise its areas of intervention. The issue of relative weightage of these parameters will however, remain. That will be taken up separately.
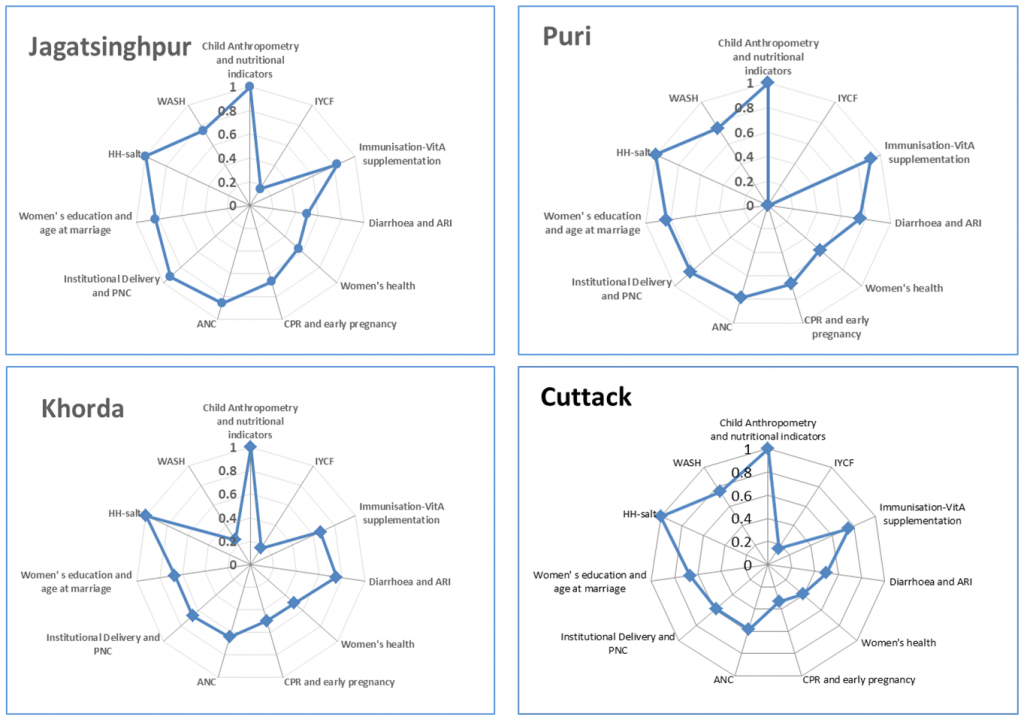
Figure 1: Radar diagram showing performance of best selected districts on different indicators that affect nutritional status of children
Burden of the problem: We now turn to an interesting aspect of the problem- the burden in absolute numbers. How many children are there likely to be moderately or severely malnourished? Every district will like to know this. We have used an easy but reasonably accurate estimate based on the census 2011 data for children in the 0-6 year age group. This number represents seven cohorts. As such 5/7th of this number will give rough estimate of the children below 60 months in the given district. Using NFHS-4 data we estimate number of malnourished children.
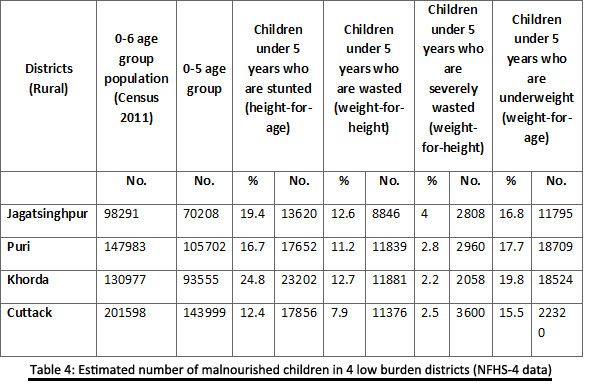
Table 4 above shows that Jagatsinghpur and Puri have the least burden of malnourished children in absolute number. In fact, the number of severely wasted children in both the districts is just below 3000. The corresponding figure for moderately wasted is about 9,000 and 12,000 respectively while children that are underweight are about 12,000 and 18,000 respectively. The average number of children within most Anganwadis will be well below a double digit figure. If we look at the ICDS project wise figure e.g. the 8 blocks of Jagatsinghpur, the numbers will be even more manageable even if we use the % underweight figures from an earlier survey CCM-II done for Odisha in 2011.
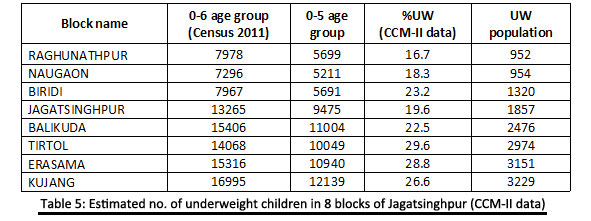
It can be nobody’s case that these districts cannot take up the task of reducing malnutrition in a campaign mode and achieve early results. The time to begin this is NOW !
[PS: Odisha is lucky to have block wise data on nutritional status and other parameters through an earlier, large sample, survey CCM-II. We will carry out similar exercise with block as a unit to identify the “closest to goal post” blocks in every district. That will be presented in the next part of our analysis.]
Satish B Agnihotri, Ayushi Jain
Nutrition Discussion Group, CTARA, IIT Bombay, Powai Mumbai 400076
Contact us: 9810307353 (Mobile), 022 576 6476
Email ID: sbagnihotri@gmail.com, ayushijain@iitb.ac.in

