Tracing the contours of deprivation View in GIS
Category: Demography – India
‘Energy Access‘: Fuel used
Tracing the contours of deprivation View in GIS
Decadal population growth rate
It stands to reason that the decadal population growth rate should also exhibit pattern similar to the population density since the growth in population density and growth in population will move in tandem if area of the state or the district has remained constant.
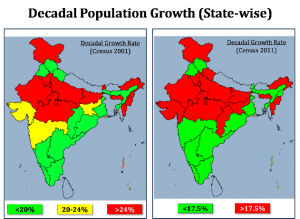
If we look at the 2001 census data for the decadal population growth among the states, three distinct belts emerge (Table). First are the states with low decadal growth rate of below 20%, basically in the south-eastern part of the country and the northern trio of Punjab (19.8), Himachal Pradesh (17.5) and Uttarakhand (19.2). Second the states with higher than 24% growth in the ‘cow belt’ and surprisingly a number of the seven sisters. Intermediate growth rate of 20 to 24% marks the remaining states in a fairly contiguous pattern.
But when we look at the district levels a threefold grouping does not help. In its place a two-fold classification of decadal growth rate of below or above 21.5% gives two clear groups of states.
How does the picture of 2011 look like? The three fold division in 2001 now gets into a twofold divide. There are states growing at less than 17.5% decadal growth rate on the south-eastern side and Punjab and Himachal Pradesh in the north. Others states in the north and north western side, and many states in the north east, growing at greater than 17.5%. A matter of concern should be the states of Uttarakhand and Chhattisgarh which show rather high rate of decadal growth compared to the 2001.
At the district level 2011 map shows an even more striking pattern. At a cut off level of 17% decadal growth rate, India gets clearly divided into two groups. Again we see a south-eastern group of districts and districts of Punjab and Himachal growing below this cut-off level with rest of the districts continuing at a faster pace.
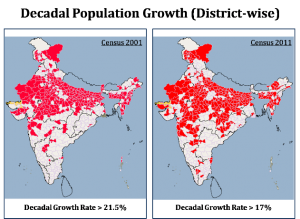
What conclusions do viewers like to draw from these patterns?
[Win prizes for insightful contributions and acknowledgments certainly.]
Population density
Any discussion of the census data immediately brings to mind the issue of population growth rate and consequentially, the population density. We put up for views and comment certain nuances of the two indicators. We show that there are clear regional patterns and contiguous belts with different bands or range of the two indicators. We also see that, contrary to the popular belief that population growth is the cause of poverty, we see a four-fold grouping: Low population density low development, Low population density and high development, high population density high development and high population density with low development.
Viewers are welcome to fine tune the analysis further.
India’s population density has grown from 325 persons per sq km in 2001 to 382 persons per sq km in 2011 an increase of 17.5%. This is understandable given the growing population on the same land mass. But averages could be deceptive! Different regions of India have grown at different pace; growth has been on account of natural population growth as well as migration. Table gives the population density figures at the state level for the 2001 and 2011 census.
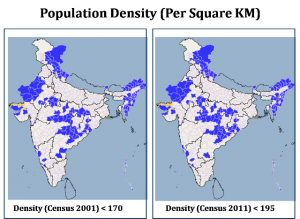
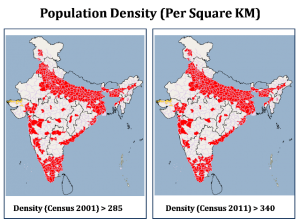
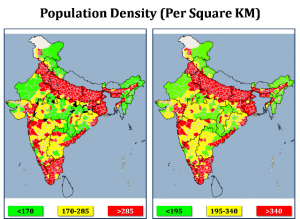
The Indian landscape can roughly be divided into three categories based on whether the population density is low, medium or high. In 2001 the cut off levels of less than 170 persons per sq km, 170 – 285 persons per sq km and above 285 persons per sq km give three contiguous belts where the population density can be considered to be high. In 2011 the density is expected to grow. What is remarkable, however, is that the same spatial classification persists if the levels are adjusted to 195 in place of 170 and 340 in the place of 285.
This means that the low density areas remain as such and so do the high population density areas. It will be useful to have a look at the growth rate of population density. The state level population density between 2011 and 2001 are related to each other very strongly and can be described as
Pop Density (2011) = 1.176x Pop Density (2001) + 2.56
This is consistent with the overall growth % of 17.5% at all India level.
[Following analysis can be skipped by viewers without loss of continuity, the statistics savvy viewers may engage with it further]
However, it the district level the picture may change. It is instructive to see has the low, medium and high density regions have experienced the change in population density.
y = 1.078x + 52.039 R Sq = 0.98 (all districts)
y = 1.0942x + 5.005 R Sq = 0.96 (2011 Pop Den < 190)
y = 0.8939x + 58.426 R Sq = 0.81 (Pop Den between 190 to 340)
y = 1.1052x + 7.6483 R Sq = 0.96 (Pop Den between 340 to 1000)
y = 1.1653x + 1.6095 R Sq = 0.97 (2011 Pop Den > 1000)
This reinforces the pattern that low population density districts are growing slower that the medium and high population density districts.
An interesting point arises here. Contrary to the general perception that lays all the blame of underdevelopment at the door-steps of population growth, we get a more nuanced pattern. We have low density regions with high as well as low levels of development and equally importantly there are high density districts which are developed as well as underdeveloped.
