‘Energy Access‘: Bringing the data together

While individual maps are helpful in understanding the spatial distribution of a given source of energy, these do not help us assimilate the overall picture at a glance. This can be done quietly elegantly by arranging the data in a table and colour code the cell to depict the high, medium and low values.

Table -1 shows such an arrangement using state-wise data for different sources of lighting. The table is quite revealing. It clearly shows that between themselves electricity and kerosene covers almost all the households barring small percentage of households covered by solar and ‘any other’.

Use of kerosene in urban areas for lighting needs to be viewed seriously and brought down speedily.

The position of Bihar is quite eye opener. Both rural and urban Bihar are doing quite badly both in electricity consumption and kerosene consumption. Rural UP also fares very badly though urban UP seems to have fared better than Bihar.

Table – 2 provides similar information in respect of sources of fuel. Here the variables are many more. Readers are expected to draw their own conclusion. The figure of kerosene consumption is urban Chandigarh is very intriguing. We also need to note similar situation in urban Tamil Nadu and Puducherry. Low LPG penetration in eastern states is also a matter of concern. Colour coding for the total (Rural + Urban) category has not been done. Reader is left to do this as a useful exercise.

We will next move to a state by state analysis with block / tehsil level data. Readers are requested to give a feedback on the colour coding methodology for a tabular data.

Patterns of urbanisastion

When we talk of the patterns of population density or the decennial growth rates, the distinction between the urban and the rural segment assumes significance. The urban population in Indian is growing – some say it is growing significantly faster than the rural population. Is that really the case? It is important to check this out on the basis of the census data on urbanization in India for 2001 and 2011. Is the popular perception that the urban population is growing rapidly correct, or does it need to be qualified? This is important since the perception of population ‘explosion’, nurtured and strongly believed in, by the urban elite does form the basis of many of our policy prescriptions and attitude towards the poor and the women.

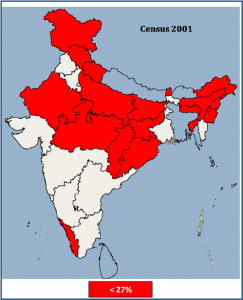
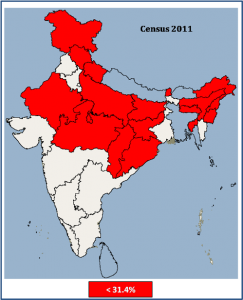
Table 1 gives the % urban population in various states in 2001 and 2011. The urbanization levels vary widely from state to state ranging from a very low level of urban population even in 2011, in Himachal (10%), Bihar (11.3%) and Assam (14.1%). If we see the map for 2001, however, we see a contiguous belt of northern and eastern states with less than 27% urban population. Even in 2011 the pattern remains similar if we raise the cut-off to 31.4%. Two notable exceptions are Kerala and Goa in the south where the urban population has jumped from 26% to 46% for Kerala and from 50% to 62% for Goa. In the north east, Sikkim, Nagaland and Tripura have urbanized significantly. West Bengal’s urbanization is historical in nature but one can see that its urbanization has not had the kind of spread effect that we see in south and the west and even in the Punjab, Haryana and Uttarakhand belt.

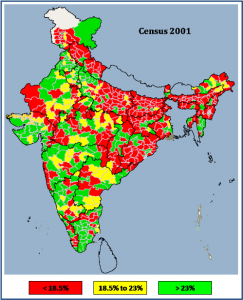
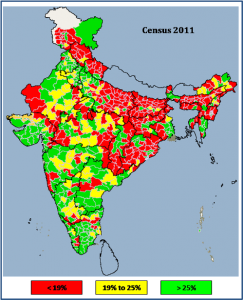
If we go to the district level, we again see similar endurance of the patterns. For 2001, the map provides clusters of low (below 18.5%) medium (18.5% to 23%) and high (>23%) urban population. Obviously if we keep same cut off levels for 2011, the area under low urban population will show a decline and that under high urban population will show an increase. But we need to appreciate that the all-India urban population % has gone up from 27.8% in 2001 to 31.2 % in 2011. We need to revise the cut-off levels upwards to see the relative patterns of urban clusters.

A revision of cut-off levels to 19%, and 25% respectively, shows that the relative pattern of urbanization has remained nearly similar.

Interestingly, the modification in the cut off for the low, medium and high urban population % regions for pattern of relative urbanization similar to that in 2001 is well below the all India increase of above 3% in the urban population%. How do we account for this? Probably the more urbanized regions are urbanizing more rapidly?

To examine this, let us place the districts in four categories; – urban population of more than 10 lakh (or 1million), between 5 to 10 lakh, 1 to 5 lakh and below 1 lakh in 2011. There are about 99 districts with 1 million plus population, 105 in the urban population range of 5-10 lakhs, 284 between 1-5 lakh and 152 below 1 lakh. Are these urbanising evenly?

In the 1 million + category there are many districts, about 22, with high urban population (above 70%), but in the 5-10 lakh bracket districts such number is just 2, in the 1-5 lakh category only 2 districts have urban population above 60% while in the <1lakh population group there are hardly any districts with more than 60% urban population.

More interestingly however, if we see the relation between the % urban population in 2001 and that in the 2011 through a regression analysis for the four categories of districts, an interesting feature emerges. This is shown in the 4 equations below;

UrbPct 2011 =  0.90*UrbPct 2001 + 11.1   [R Sq = 0.89] —-     (1 million+)

UrbPct 2011 =  0.98* UrbPct 2001 + 4.4   [R Sq = 0.85] —— (5-10 lakh)

UrbPct 2011 =  1.1* UrbPct 2001 + 0.32   [R Sq = 0.87]   —— (1-5 lakh)

UrbPct 2011 =  1.01* UrbPct 2001 + 1.65   [R Sq = 0.82]   —–  (< 1 lakh)

This implies that the districts with larger urban population in 2001 have urbanized to a larger extent. The 1 million+ districts have added on an average 8-10% urban population, districts with 5-10 lakh population have added about 4.5%, districts with less than one lakh urban population in 2001 have added just about 2.5% while districts in the 1-5 lakh category have indicated about a 10% increase in the urbanization %.

The gender gap: Interestingly, the gap between the %urban population for the male and the female population has narrowed between 2001 and 2011 both at the all India level and the district level in different size ranges. In 2001 the urban male population accounted for 28.3% of the total male population while the urban female population accounted for 27.3% of the female population. This gap has narrowed in 2011 with the urban male and the urban female population accounting for 31.4 and 30.9% of the total male and the female population respectively. In the 1 million plus districts and the 1-5 lakh districts category too, the gender gap has reduced between 2001 and 2011.


Decadal population growth rate

It stands to reason that the decadal population growth rate should also exhibit pattern similar to the population density since the growth in population density and growth in population will move in tandem if area of the state or the district has remained constant.

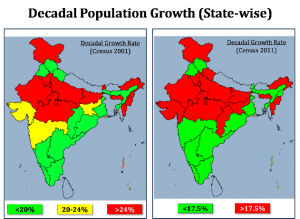
If we look at the 2001 census data for the decadal population growth among the states, three distinct belts emerge (Table). First are the states with low decadal growth rate of below 20%, basically in the south-eastern part of the country and the northern trio of Punjab (19.8), Himachal Pradesh (17.5) and Uttarakhand (19.2). Second the states with higher than 24% growth in the ‘cow belt’ and surprisingly a number of the seven sisters. Intermediate growth rate of 20 to 24% marks the remaining states in a fairly contiguous pattern.

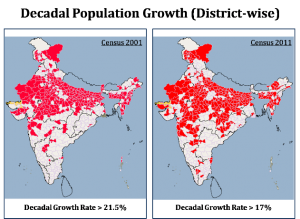
But when we look at the district levels a threefold grouping does not help. In its place a two-fold classification of decadal growth rate of below or above 21.5% gives two clear groups of states.

How does the picture of 2011 look like? The three fold division in 2001 now gets into a twofold divide. There are states growing at less than 17.5% decadal growth rate on the south-eastern side and Punjab and Himachal Pradesh in the north. Others states in the north and north western side, and many states in the north east, growing at greater than 17.5%. A matter of concern should be the states of Uttarakhand and Chhattisgarh which show rather high rate of decadal growth compared to the 2001.

At the district level 2011 map shows an even more striking pattern. At a cut off level of 17% decadal growth rate, India gets clearly divided into two groups. Again we see a south-eastern group of districts and districts of Punjab and Himachal growing below this cut-off level with rest of the districts continuing at a faster pace.

What conclusions do viewers like to draw from these patterns?

[Win prizes for insightful contributions and acknowledgments certainly.]

Population density

Any discussion of the census data immediately brings to mind the issue of population growth rate and consequentially, the population density. We put up for views and comment certain nuances of the two indicators. We show that there are clear regional patterns and contiguous belts with different bands or range of the two indicators. We also see that, contrary to the popular belief that population growth is the cause of poverty, we see a four-fold grouping: Low population density low development, Low population density and high development, high population density high development and high population density with low development.

Viewers are welcome to fine tune the analysis further.

India’s population density has grown from 325 persons per sq km in 2001 to 382 persons per sq km in 2011 an increase of 17.5%. This is understandable given the growing population on the same land mass. But averages could be deceptive! Different regions of India have grown at different pace; growth has been on account of natural population growth as well as migration. Table gives the population density figures at the state level for the 2001 and 2011 census.

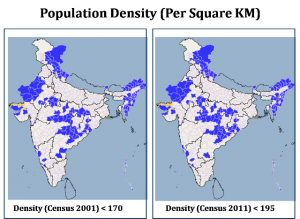
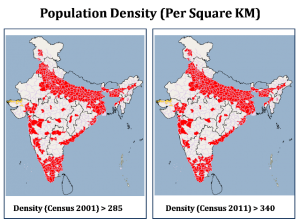
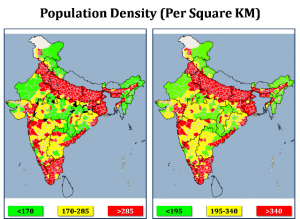
The Indian landscape can roughly be divided into three categories based on whether the population density is low, medium or high. In 2001 the cut off levels of less than 170 persons per sq km, 170 – 285 persons per sq km and above 285 persons per sq km give three contiguous belts where the population density can be considered to be high. In 2011 the density is expected to grow. What is remarkable, however, is that the same spatial classification persists if the levels are adjusted to 195 in place of 170 and 340 in the place of 285.

This means that the low density areas remain as such and so do the high population density areas. It will be useful to have a look at the growth rate of population density. The state level population density between 2011 and 2001 are related to each other very strongly and can be described as

Pop Density (2011) = 1.176x Pop Density (2001) + 2.56

This is consistent with the overall growth % of 17.5% at all India level.

[Following analysis can be skipped by viewers without loss of continuity, the statistics savvy viewers may engage with it further]

However, it the district level the picture may change. It is instructive to see has the low, medium and high density regions have experienced the change in population density.

y = 1.078x + 52.039 R Sq = 0.98 (all districts)

y = 1.0942x + 5.005 R Sq = 0.96 (2011 Pop Den < 190)

y = 0.8939x + 58.426 R Sq = 0.81    (Pop Den between 190 to 340)

y = 1.1052x + 7.6483 R Sq = 0.96 (Pop Den between 340 to 1000)

y = 1.1653x + 1.6095 R Sq = 0.97 (2011 Pop Den > 1000)

This reinforces the pattern that low population density districts are growing slower that the medium and high population density districts.

An interesting point arises here. Contrary to the general perception that lays all the blame of underdevelopment at the door-steps of population growth, we get a more nuanced pattern. We have low density regions with high as well as low levels of development and equally importantly there are high density districts which are developed as well as underdeveloped.